JS SEO Lab: empirical research on JavaScript content patterns in the LLM era
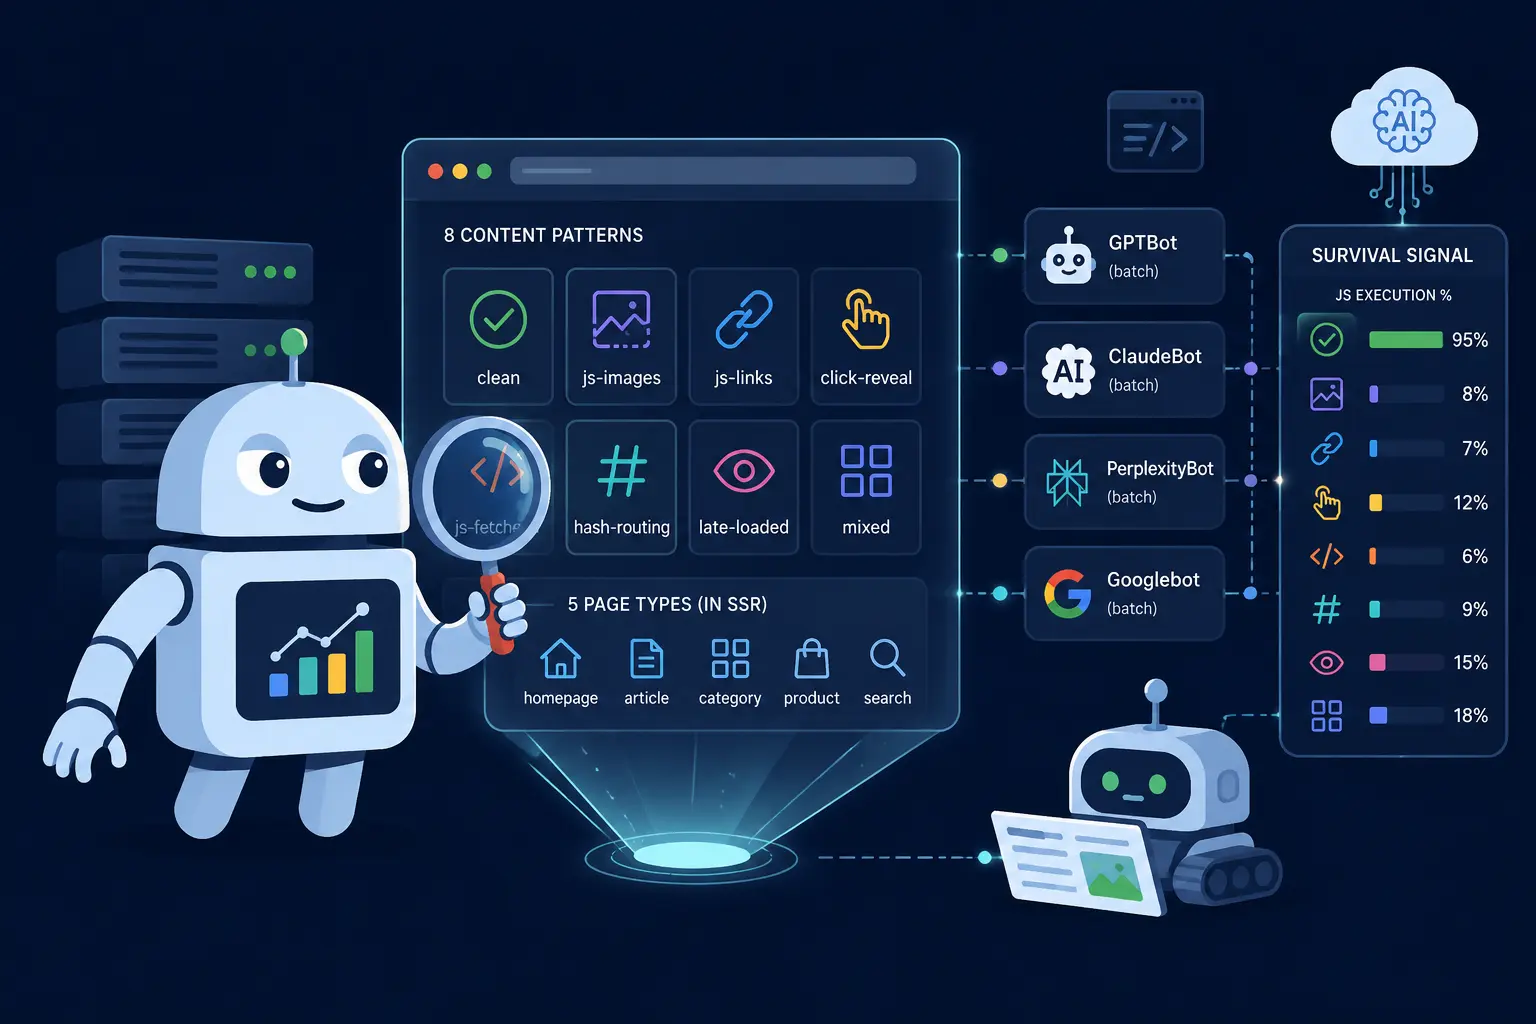
JS SEO Lab (jsseo.dev) is an open research laboratory run by Jakub Sawa, measuring how eight JavaScript content patterns (clean, js-images, js-links, click-reveal, js-fetched, hash-routing, late-loaded, mixed) perform across twenty-seven bot classes. The classes include batch AI crawlers (GPTBot, ClaudeBot, PerplexityBot, Bytespider, CCBot, Meta-ExternalAgent), on-demand fetchers triggered by LLM user prompts (ChatGPT-User, Claude-User, Claude-SearchBot, Perplexity-User, Bing Copilot), and traditional search engines (Googlebot, Bingbot, Applebot). Each pattern is tested across five page types (homepage, article, category, product, search) in three rendering modes (SSR, CSR, SSG) on a live Next.js test bed at next.jsseo.dev. The tracker uses three independent layers: Next.js middleware, a Cloudflare GraphQL Analytics ingester, and a post-hydration JavaScript beacon. Bot identification runs through reverse DNS (Google, Bing, Apple) and IP-range CIDR matching against published manifests (OpenAI, Perplexity, Anthropic). Six hypotheses are pre-registered in the public GitHub repository before any data collection begins. Data is CC0, code is MIT, prose is CC-BY. Phase 1 starts in May 2026. First findings expected: June 2026.
Every few months someone messages me with a variation on the same question. "Jakub, we migrated to Next.js and half our product cards aren't appearing in ChatGPT. The content shows up fine in the browser. What's happening?". Or: "the article body isn't surfacing in Perplexity, although Google indexes it without issues". Or: "an external agency's audit says we have a rendering problem, but no specifics".
None of these questions mention "rendering mode", "hydration", or "SSR vs CSR". Nobody asks about the framework in the abstract. The question is always concrete: why a specific piece of information on a specific page isn't reaching a specific bot.
And for six weeks I was building a test bed designed to answer a different question entirely. A question that already has a public answer.
That's why today I scrapped everything and started over. This time I'm measuring what actually breaks audits in the field. The project is called JS SEO Lab, lives at jsseo.dev, and has been open since day one. Below is what I built, what I tore down, what I'm measuring now, and why I think this is the most interesting research I'll ship this year.
What I didn't need to measure
In 2024 Vercel and MERJ published The Rise of the AI Crawler. They instrumented Vercel's edge, measured billions of requests from batch AI crawlers (GPTBot, ClaudeBot, PerplexityBot, Bytespider, CCBot, Meta-ExternalAgent), plus Googlebot as a reference.
The finding is strong and simple. Batch AI crawlers don't execute JavaScript. Not "rarely", not "with some delay". They don't execute it at all. GPTBot fetches .js files in about 11.5% of requests and never runs them. ClaudeBot fetches them in 23.8%, same outcome. PerplexityBot, Bytespider, CCBot, the entire batch crawl population reads HTML, ignores scripts, moves on.
Once you have that finding, the rendering-mode question becomes trivial. SSR, SSG, ISR, RSC streaming, Edge SSR all emit static HTML in the first response. To a non-JS bot they're indistinguishable. The single exception is CSR, where the server returns an empty shell and content arrives client-side. Every other server-rendering mode looks identical from the perspective of a non-JS bot.
I spent six weeks building a test bed designed to measure exactly those axes: SSR vs SSG vs ISR vs RSC vs Edge SSR vs CSR. Six modes times five page types times image variants. One hundred and forty-four cells to populate. The tracker was up, the dashboard worked, GPTBot was already walking the cells.
If I had finished it, I would have published, six months from now, a post titled "we confirm Vercel/MERJ findings on a new dataset". Replication has value. But that's not what clients need.
What we actually don't know
A real technical audit never starts with "is the rendering mode correct". It starts with concrete symptoms:
The product price doesn't appear in ChatGPT results, even though the browser shows it instantly. A click-to-reveal FAQ block disappeared from Google. Navigation uses <button onClick={navigate}> instead of <a href> because the design team wanted hover animations, and now internal links stopped working for the crawler. The category page item list is fetched via fetch('/api/products') after hydration, and from GPTBot's perspective the category pages are empty.
These are all questions about a JavaScript pattern on the page, not the rendering mode. The same SSR page can contain:
- an
<img>whosesrcis set only after mount throughuseEffect - a
<button onClick>impersonating a link, with no realhref - a "show more" gate hiding the article body until clicked
- a
fetch('/api/...')powering the price inside a product card - hash-routed sub-navigation (
#/tab-ainstead of real/tab-a) - an IntersectionObserver revealing a related-articles block
Every one of these lives inside SSR. In my original 144-cell matrix each of them would have looked identical. What the bot sees, or doesn't see, depends on the specific pattern, not on the rendering mode.
The eight patterns
I narrowed it down to a catalogue of eight. These are the patterns I see most often in real audits, and they're disjoint enough that the visibility signal per pattern stays interpretable on its own.
clean. Baseline. All content in SSR HTML, zero JS-injected content. Reference point.
js-images. The <img src> attribute is set client-side through useEffect after mount. A common consequence of React state setters where the initial value is an empty string. In React 19 the src attribute is omitted entirely from SSR output when the state is an empty string. A crawler without JS gets an <img> tag with nothing to fetch.
js-links. Navigation through <button onClick={router.push}> instead of <a href>. A design classic from the past two years. Identical for users, invisible to bots.
click-reveal. Main content hidden behind a "show more" gate until the user clicks. Used on FAQ blocks, product descriptions, expandable article sections.
js-fetched. Content fetched client-side from an API after mount. Prices inside product cards. Reviews. Stock counts. Recommended products.
hash-routing. URL fragments #/path instead of real paths /path. A legacy SPA artifact, but still occasionally landing inside new projects.
late-loaded. Content rendered only after an IntersectionObserver fires. Lazy-loaded sections like "related articles", "recently viewed", "customers also bought".
mixed. A realistic combination of the above. A product card with js-fetched price, lazy-loaded image, and click-reveal reviews. Because in real production nobody ships a clean pattern in isolation.
Each of the eight is tested across five page types (homepage, article, category, product, search) in SSR mode. CSR acts as a negative control. SSG as a sanity check. Together that's 55 cells instead of 144, and each one answers a specific audit question.
The cells are live at next.jsseo.dev. Open any of them, view source, and you'll see the pattern in raw form. In the js-images cells no <img> tag in the initial HTML carries a src attribute. React 19 drops it because the state value is an empty string. The crawler without JS receives the tag with nothing.
Three tracking layers
Measurement itself is the second problem. "GPTBot visited the cell five times" tells me nothing. I want to know whether GPTBot saw the content, or only the loading placeholder.
The jsseo.dev tracker runs on three independent layers that overlap and cross-validate:
Layer 1. Next.js middleware logs every hit before the response leaves the worker. A fire-and-forget POST to track.jsseo.dev/api/hit via ctx.waitUntil(). This is the primary stream.
Layer 2. A Cloudflare GraphQL Analytics ingester pulls hits that Cloudflare logged at the edge but that bypassed the worker (prerendered statics, edge cache hits). 60-second poll lag, deduplication via a natural-key hash. This catches what Layer 1 would miss.
Layer 3. A small <script> in the HTML that POSTs to /api/js-executed after hydration. Bots that execute JavaScript fire the beacon. Bots that don't, don't. The tracker joins beacon events with hit rows by the per-cell marker UUID. The dashboard then shows js_executed_pct per (pattern, bot class). That's the proper pattern-survival signal.
Layer 3 hasn't shipped yet. The infrastructure is done. What's missing is the beacon itself and a schema migration to store the events. Estimated two hours of work. I separated it from the architecture sprints deliberately, so I can validate it as a discrete step.
Bot identification
Twenty-seven bot classes recognized, three verification paths:
rDNS for Google, Bing, Apple. Reverse DNS plus forward confirmation against the bot's published domain (*.googlebot.com, *.search.msn.com, *.applebot.apple.com).
IP-range for OpenAI, Perplexity, Anthropic. CIDR membership check against published JSON manifests, refreshed every six hours. Plus a hardcoded list for Anthropic, whose published source is an HTML page rather than JSON.
none / auto-unverified. Deprecated pre-2024 user agents (anthropic-ai, Claude-Web) are auto-flagged as untrusted on insert. They never reach the verification queue, and their counts are visibly separated on the dashboard.
HTTP Message Signature (RFC 9421) header detection has also landed for ChatGPT Agent's signed requests. Signature verification against published key sets is queued for later. For now I only detect presence.
LLM fetch testing
Running parallel to bot tracking is a second measurement. Periodic prompt-driven tests where I ask nine LLM surfaces what they see when told to fetch a specific URL from the test bed. ChatGPT, Claude, Perplexity, Gemini, Bing Copilot. Web UI and API where available.
Class A prompts tell the model: "fetch this page, describe what you see". Each response is scored 0-4 (fetch failed, placeholder only, partial content, full but inaccurate, full and accurate) with binary flags for marker_detected, images_described, structured_data_used.
Cadence: a weekly full sweep across all cells across all surfaces. Daily focused probes on 24 high-signal cells. Manual sampling 5-10 cells per week in chat UIs, to catch divergence between API and chat surfaces.
Six hypotheses and the kill criterion
Six hypotheses committed to the repository before the first hit landed:
H1 (sanity check). clean SSR ≡ clean SSG for batch crawlers. If this fails, the methodology is broken.
H2. clean SSR is fully visible to all batch AI crawlers. GPTBot, ClaudeBot, PerplexityBot, Bytespider, CCBot.
H3 (main test). Patterns js-images, js-links, click-reveal, js-fetched, hash-routing, late-loaded produce invisible main content for batch AI crawlers.
H4. Googlebot (and Gemini, sharing infrastructure) eventually renders all eight patterns, with a measurable per-pattern delay versus clean.
H5. On-demand fetchers (ChatGPT-User, Claude-User, Claude-SearchBot, Perplexity-User, Bing Copilot) behave exploratorily, no strong prior. The split between a batch crawler (GPTBot) and its on-demand counterpart (ChatGPT-User) for the same provider is the most-watched signal of the project.
H6. Bing rendering of JavaScript patterns is inconsistent. First systematic Bing data since the 2019 Edge crawler note.
Kill criterion: if pattern js-images shows no visibility difference versus clean for batch AI crawlers, the methodology is broken and the investigation halts. Vercel/MERJ 2024 sets a strong baseline that this prediction should hold.
H5 is the one I'm watching most closely. I have no strong prior. We know batch crawlers don't execute JS. We don't know systematically what on-demand fetchers do when invoked because a user just asked an LLM about something specific. Do they execute JavaScript? Do they cache differently? Do they handle POSTs differently than GETs? Nobody has measured that publicly yet.
That's the actual interesting question.
Open from day one
The whole project is public from the start. Repository at github.com/Qbeczek1/jsseo-dev. Test bed source under apps/next/. Tracker server source under tracker-server/. Raw tracker data published in the repo under data/. All analysis code under analysis/. One command and anyone reproduces the results from raw data.
Licensing: CC0 for data, MIT for code, CC-BY for prose. Take it, copy it, replicate the experiment on your own framework. The single requirement: if you cite, name the source.
This isn't decoration. It's part of the construction. In a typical "internal replication of Vercel's findings" the result sits in an agency PDF that nobody can verify. Here every figure on the dashboard has a raw row in SQLite, every raw row has a timestamp and a fingerprint, every fingerprint traces back to a specific request against a specific cell. If anyone doubts a metric, they open data/ and see for themselves.
What the dashboard doesn't show yet
Current state: tracker truncated today, 101 hits collected total, no Googlebot or Claude hits yet, GPTBot dominates. Three bot classes total. Layer 3 isn't running, so the js_executed_pct column doesn't exist yet. Hit count is coverage, not survival.
This isn't the point to publish findings. This is the zero point. First data-driven findings are planned for June 2026, after Layer 3 ships plus roughly a week of clean traffic on the fresh schema.
What's next
The plan for the coming weeks is fairly simple.
Sprint 4, two hours of work, ships the Layer 3 beacon and the schema migration for events. After that the dashboard gains a js_executed_pct column per (pattern, bot class). That's the proper survival signal.
A week of clean traffic on the new schema. No smoke tests, no leftover hits from the mode-axis phase. The tracker got truncated to zero today, deliberately, so the baseline starts clean.
The first findings post (data-anchored) lands when I actually have something to say. Not before. There's no point publishing "conclusions after three days", because day-to-day variance is bigger than real differences between bot classes.
Long-term Phase 1 is twelve weeks of data collection. Phase 2, if Phase 1 produces results worth continuing, means additional frameworks: Nuxt, Astro, SvelteKit, possibly Solid or Qwik. Each framework gets its own test subdomain. But I'm not committing to Phase 2 yet, because Phase 1 is barely starting.
Why I'm doing this
From a consulting perspective: if a client comes to me six months from now with a Next.js migration and the question "why aren't our prices showing up in ChatGPT", I want a measurement table, not intuition. I want to tell them directly: "your js-fetched + click-reveal combination has 0% survival in GPTBot, but 73% in ChatGPT-User, so the content surfaces only when somebody asks about your product explicitly". That's a value no tool on the market sells.
From an industry perspective: the last systematic public JS SEO tests come from Onely and a handful of American consultants. They all focus on Googlebot. A pattern × bot map covering the full LLM era doesn't exist. This project builds it.
From a personal perspective: 25 years in SEO and this is the first project where I'm starting with hypothesis pre-registration. With a kill criterion. With an open dataset from day one. It's my private replica of what real science is supposed to look like, in a discipline where marketing research rarely runs a second iteration.
First findings: June 2026. Subscribe to the RSS feed at jsseo.dev/feed.xml. I'll cross-post highlights on LinkedIn at /in/jakubsawa. All links, sources, and code at jsseo.dev.
The infrastructure is done. The measurement starts today. Let's see what survives.